
Weekly Report
week 20 2016
Article source: Date time:2016-06-27
Chinese Influenza Weekly Report
(All data are preliminary and may change as more reports are received)
Outbreak Surveillance
During week 20 (May 16–22, 2016), there was 8outbreaks reported nationwide, 6 of them were B, 2 of them were untyped.
Surveillance of outpatient or emergency visits for Influenza-like Illness (ILI)
During week 20, the percentage of outpatient or emergency visits for ILI (ILI %) at national sentinel hospitals in south China was 3.5% , lower than last week 3.6% ,higher than the same week of 2014 and 2015(3.1% and 3.1%). (Figure 1)
Figure 1. Percentage of Visits for ILI at Sentinel Hospitalsin South China
(2012–2016)
During week 20, ILI% at national sentinel hospitals in north China was 2.4%,same as last week and the same week of 2015(2.4%and 2.4%),lower than the same week of 2014(2.5%). (Figure 2)
Figure 2. Percentage of Visits for ILI at Sentinel Hospitals in North China
(2012–2016)
Virologic Surveillance
During week 20, influenza network laboratories tested3551specimens, of which 273(7.7%) were positive for influenza, influenza A and influenza B virus were 39(14.3%) and 234(85.7%), respectively (Table 1). During week 20, the percentage of specimens that were tested positive for influenza in south China was9.0%, which was lower than the previous week (10.7%) (Figure 3).During week 20, the percentage of specimens that were tested positive for influenza in north China was2.9%, which was higher than the previous week (2.0%)(Figure 4).
Table 1Laboratory Detections of ILI Specimens (Week 20, 2016)
|
|
Week 20 |
||
|
South China |
North China |
Total |
|
|
No. of specimens tested |
2804 |
747 |
3551 |
|
No. of positive specimens (%) |
251(9.0%) |
22(2.9%) |
273(7.7%) |
|
Influenza A |
34(13.5%) |
5(22.7%) |
39(14.3%) |
|
A(H3N2) |
2(5.9%) |
0(0) |
2(5.1%) |
|
A(H1N1)pdm09 |
32(94.1%) |
5(100%) |
37(94.8%) |
|
A (subtype not determined) |
0(0) |
0(0) |
0(0) |
|
Influenza B |
217(86.5%) |
17(77.3%) |
234(85.7%) |
|
B (lineage not determined) |
52(24.0%) |
4(23.5%) |
56(23.9%) |
|
Victoria |
147(67.7%) |
11(64.7%) |
158(67.5%) |
|
Yamagata |
18(8.3%) |
2(11.8%) |
20(8.5%) |
Figure 3. Influenza Positive Tests Reported by Southern Network Laboratories (Week 14, 2015–Week 20, 2016)
Note: Analysis in this part was based on the test results of network laboratories. If it were not consistent with the results of CNIC confirmation, the results of CNIC confirmation were used.
Figure 4. Influenza Positive Tests Reported by Northern Network Laboratories (Week 14, 2015–Week 20, 2016)
Note: Analysis in this part was based on the result of network laboratories. If it were not consistent with the results of CNIC confirmation, the results of CNIC confirmation were used.
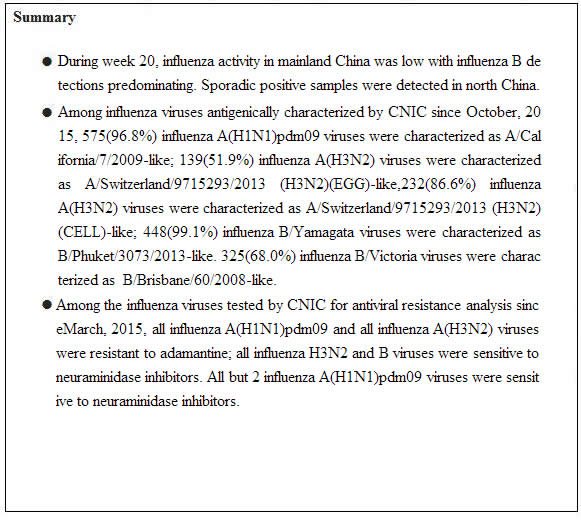
Antigenic Characterization
Since October 1st, 2015, 575(96.8%) of the 594 A(H1N1)pdm09 viruses tested were characterized as A/California/7/2009-like;139(51.9%) of the 268A(H3N2) influenza viruses tested were characterized as A/Switzerland/9715293/2013 (H3N2)(EGG)-like, 232(86.6%) of the 268A(H3N2) influenza viruses tested were characterized as A/Switzerland/9715293/2013 (H3N2)(CELL)-like; 448(99.1%) of the 452 influenza B/Yamagata lineage viruses tested were characterized as B/Phuket/3073/2013-like; 325(68.0%) of the 478 influenza B/Victoria lineage viruses tested have been characterized as B/Brisbane/60/2008-like.
Antiviral Resistance
Since October 1st, 2015, among the influenza viruses tested by CNIC for antiviral resistance, all influenza A(H1N1)pdm09 and all influenza A(H3N2) viruses were resistant to adamantine ; all influenzaA(H3N2) and B viruses were sensitive to neuraminidase inhibitors. All but 2 influenza A(H1N1)pdm09 viruses were sensitive to neuraminidase inhibitors.
