
Weekly Report
Week 37 2012
Article source: Date time:2012-09-24
Download:7.rar
Chinese Influenza Weekly Report
(Week 37, September 10 – 16, 2012)
(All data are preliminary and may change as more reports are received)
|
Summary |
Outbreak Surveillance
During week 37, no outbreak was reported nationwide.
Influenza-like Illness (ILI) Surveillance
During week 37, the percentage of visits with ILI (ILI%) of national sentinel hospitals in south China was 2.6%, which was similar as that of week 36 (2.6%). It was lower than the level seen during the same period of the previous year (2.8%).
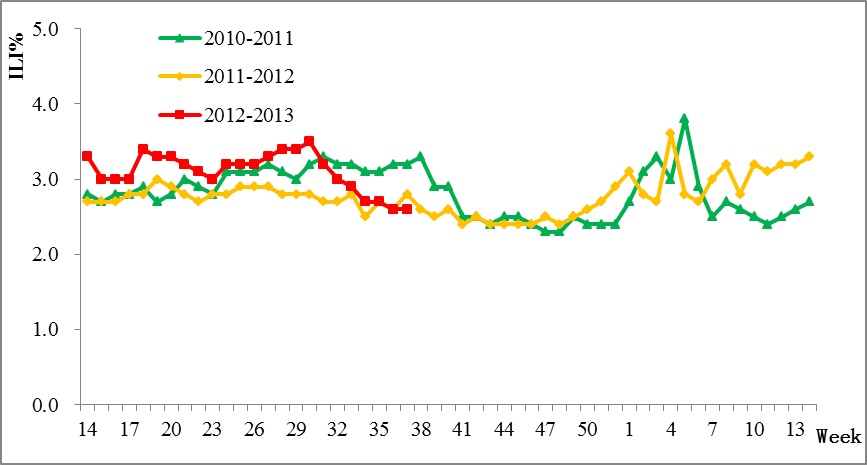
Figure 1. Percentage of Visits for ILI of Sentinel Hospitals in South China (2010-2013)
During week 37, the ILI% of national sentinel hospitals in north China was 2.8%, which was higher than that of week 36 (2.7%). It was also higher than the level seen during the same period of the previous year (2.3%).

Figure 2. Percentage of Visits for ILI of Sentinel Hospitals in North China (2010-2013)
Virologic Surveillance
During week 37, network laboratories tested 1173 specimens, of which 136 (11.6%) were positive for influenza, and influenza A was predominant. During week 37, the percentage of tests that were positive for influenza in south China was 11.9%, which was lower than that in the previous week (14.2%). The percentage of tests that were positive for influenza in north China in the same week was 10.1%, which was higher than that in the previous week (7.4%) (Detailed information of influenza laboratory detections of south and north China is shown as Table 1).
Table 1 Laboratory Detections of ILI Specimens (Week 37, 2012)
|
|
Week 37 |
||
|
South China |
North China |
Total |
|
|
No. of specimens tested |
1004 |
169 |
1173 |
|
No. of positive specimens (%) |
119(11.9%) |
17(10.1%) |
136(11.6%) |
|
Influenza A |
114(95.8%) |
17(100%) |
131(96.3%) |
|
A(H1N1) |
0(0) |
0(0) |
0(0) |
|
A(H3N2) |
102(89.5%) |
12(70.6%) |
114(87.0%) |
|
Pandemic influenza H1N1 2009 |
0(0) |
0(0) |
1(0.5%) |
|
A (subtype not determined) |
12(10.5%) |
5(29.4%) |
17(13.0%) |
|
Influenza B |
5(4.2%) |
0(0) |
5(3.7%) |
|
B (lineage not determined) |
5(100%) |
0(0) |
5(100%) |
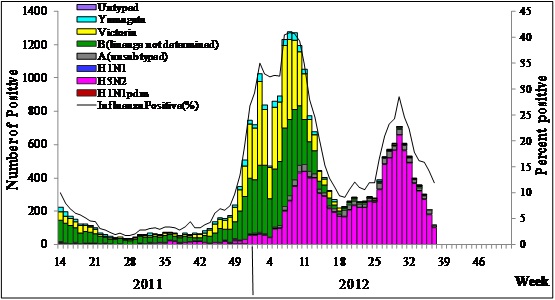
Figure 3. Influenza positive tests reported by southern network laboratories (Week 14, 2011 –Week 37, 2012)
Note:
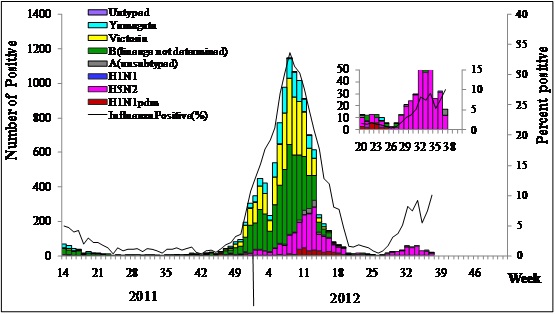
Figure 4. Influenza positive tests reported by northern network laboratories (Week 14, 2011–Week 37, 2012)
Note:
Antigenic Characterization
During week 37, CNIC has antigenically characterized 32 influenza A (H3N2) viruses. 27 (84.4%) are related to A/Perth/16/2009-like; 5 (15.6%) demonstrate reduced titers (≥8 fold lower in HI titer) with anti-sera produced against A/Perth/16/2009.
During week 37, CNIC has antigenically characterized 4 influenza B/Yamagata viruses. All of them are related to B/Wisconsin/01/2010-like.
During October 1, 2011 – September 16, 2012, CNIC has antigenically characterized 50 pandemic influenza H1N1 2009 viruses. 45 (90.0%) are related to A/California/7/2009-like; 5 (10.0%) demonstrate reduced titers (≥8 fold lower in HI titer) with anti-sera produced against
During October 1, 2011
During October 1, 2011
During October 1, 2011
Antiviral Resistance
During October 1, 2011 – September 16, 2012, among influenza viruses tested by CNIC for antiviral resistance, all pandemic influenza H1N1 2009 and influenza A (H3N2) viruses are resistant to adamantine and sensitive to the neuraminidase inhibitors; all influenza B viruses are sensitive to neuraminidase inhibitors.
