
Weekly Report
Week 33 2010
Article source: Date time:2010-08-30
Download:3.pdf
Chinese Influenza Weekly Report
(All data are preliminary and may change as more reports are received)
Pandemic (H1N1) 2009 Surveillance
During week 33, 20 confirmed cases of pandemic influenza H1N1 2009 were reported. Of them, 1 was severe case, and no death case was reported. Except 1 severe case was reported in week 33, no severe case was reported during week 26-33. No death was reported for 15 consecutive weeks since week 19. Since the first case of pandemic influenza H1N1 2009 was reported on May 11, 2009, as of August 22, 2010, 128068 confirmed cases and 805 deaths of pandemic influenza H1N1 2009 have been reported nationwide, which cover 31 provinces and the Xinjiang Production and Construction Corps in mainland China.
(Note: After cases are reported to the system, the information would be checked by local CDC at all levels to ensure accuracy. From week 3, 2010, data collected in the weekly report refers to the information after examination.)
Outbreak Surveillance
During week 33, 2 outbreaks[1]
Influenza-like Illness (ILI) Surveillance
During week 33, the percentage of visits with ILI (ILI%) of sentinel hospitals in South China was 4.2%, which was similar as that of week 32 (4.2%). It was lower than the level seen during the same period of 2007-2008 (4.4%) and 2008-2009 (5.1%) season. Except for week 41 and 42, the ILI% showed an increasing trend in general since the week 34 and reached peak in week 48 (7.7%), but it decreased rapidly after that. Since week 53, it showed a fluctuated trend. From week 24, the ILI% increased slightly. (Figure 1)

Figure 1. Percentage of Visits for ILI of Sentinel Hospitals in South China (2007-2010)
During week 33, the ILI% of sentinel hospitals in North China was 3.9%, which was higher than that of week 32 (3.7%). It was lower than the level seen during the same period of 2008-2009 season (5.1%). Except for week 41, the ILI% showed an increasing trend in general since week 36, and reached peak in week 44 (12.2%). After that, it showed a declining trend and fluctuated since week 53. During week 53 to week 7, the ILI% fluctuated from 5.2% to 6.1%; since week 8, the ILI% fluctuated from 3.7% to 4.6%. (Figure 2)

Figure 2. Percentage of Visits for ILI of Sentinel Hospitals in North China (2007-2010)
Virologic Surveillance
During week 33, network laboratories tested 2285 specimens, of which 292 (12.8%) were positive for influenza: 247 (84.6%) were influenza A and 45 (15.4%) were influenza B. 3.8%
Table 1 Laboratory Detections of ILI Specimens
|
Week 33 |
|||
|
South China |
North China |
Total |
|
|
No. of specimens tested |
1620 |
665 |
2285 |
|
No. of positive specimens (%) |
257(15.9%) |
35(5.3%) |
292(12.8%) |
|
Influenza A |
213(82.9%) |
34(97.1%) |
247(84.6%) |
|
A (H1N1) |
0(0) |
1(2.9%) |
1(0.4%) |
|
A (H3N2) |
143(67.1%) |
29(85.3%) |
172(69.6%) |
|
A (pandemic influenza H1N1 2009 excluded)[2] |
54(25.4%) |
3(8.8%) |
57(23.1%) |
|
2009 |
11(5.2%) |
0(0) |
11(4.5%) |
|
A (pandemic influenza H1N1 2009 not excluded)[3] |
5(2.3%) |
1(2.9%) |
6(2.4%) |
|
Influenza B |
44(17.1%) |
1(2.9%) |
45(15.4%) |
|
B (lineage not determined) |
44(100%) |
1(100%) |
45(100%) |
The percentage of tests that were positive for influenza reached peak (60.2%) in southern China in week 48 and reached peak (50.3%) in northern China in week 47, 2009. After that, it began to decrease. During week 21 (week ending May 30) to week 30 (week ending August 1), the percentage of tests that positive for influenza of northern China remained lower than 2%. Since week 30, it increased slightly. In this week, the percentage of tests that positive for influenza of northern China was 5.3%; the percentage of tests that positive for influenza of southern China reached bottom (4.1%) in week 24 (week ending June 30) and showed an increasing trend after that. In this week, the percentage of tests that positive for influenza of southern China was 15.9%.
The percentage of pandemic influenza H1N1 2009 virus reached peaked in week 49 (week ending December 6, 2009) and week 48 (week ending November 20, 2009) in southern China (93.3%) and northern China (87.7%) respectively. Since week 48, 2009, the percentage of influenza B virus began to increase and became predominant strain in week 2, 2010 (week ending January 17, 2010). Since week 19, the percentage of influenza A in southern China showed an increasing trend. From week 29, the percentage of influenza A viruses exceeded that of influenza B viruses. In this week, the percentage of influenza A viruses in southern and northern China was 82.9% and 97.1% respectively. Influenza A (H3N2) activity showed an increasing trend recently. The percentage of influenza A (H3N2) viruses exceeded that of influenza B and other influenza A viruses and became the predominant strain in week 30. (Figure 3, Figure 4)
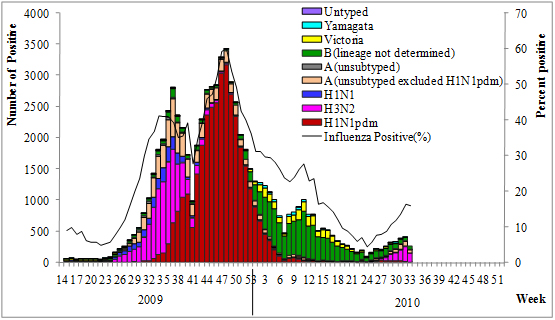
Figure 3. Influenza positive tests reported by southern network laboratories (Week 14, 2009 –Week 33, 2010)
Note:
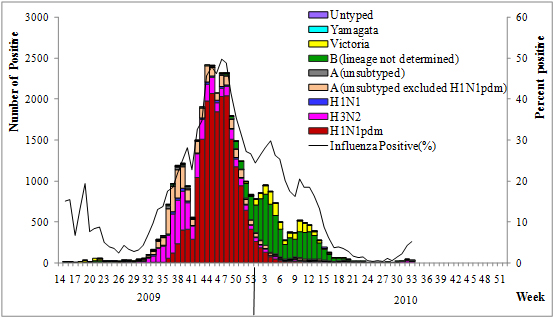
Figure 4. Influenza positive tests reported by northern network laboratories (Week 14, 2009 –Week 33, 2010)
Note:
Antigenic Characterization
1. Pandemic Influenza H1N1 2009
As of August 22, 2010, CNIC has sequenced 571 pandemic influenza H1N1 2009 viruses. All the viruses have high homology (>98%)
As of August 22, 2010, CNIC has antigenically characterized 2401 pandemic influenza H1N1 2009 viruses. 2
2. Seasonal Influenza
During week 33, CNIC has
During week 33, CNIC has
During week 33, CNIC has
During January 1- August 22, 2010, CNIC has antigenically characterized 16 influenza A (H1N1) viruses. 13 (81.3%) are related to A/Brisbane/59/2007 (H1N1)-like; 3 (18.8%) demonstrate reduced titers (≥8 fold lower in HI titer) with anti-sera produced against A/Brisbane/59/2007 (H1N1).
During January 1- August 22, 2010, CNIC has antigenically characterized 73 influenza A (H3N2) viruses. 7 (9.6%) are related to A/Brisbane/10/2007(H3N2)-like; 66 (90.4%) demonstrate reduced titers (≥8 fold lower in HI titer) with anti-sera produced against A/Brisbane/10/2007(H3N2). 50 (50/70, 71.4%) are related to A/Perth/16/2009 (H3N2)-like; 20 (20/70, 28.6%) demonstrates reduced titers
During January 1- August 22, 2010, as the antigenic characterization done by CNIC for influenza B viruses show that 1846 (1846/2075, 89.0%) are related to B/Brisbane/60/2008; 229 (229/2075, 11.0%) demonstrate
During January 1- August 22, 2010, CNIC has antigenically characterized 487 influenza B/Yamagata viruses. 365 (74.9%) are related to B/Florida/4/2006-like; 122 (25.1%) demonstrate reduced titers
Antiviral Resistance
As of August 22, 2010, CNIC has tested 571 pandemic influenza H1N1 2009 viruses for antiviral resistance by sequence analysis. All viruses are resistant to adamantine; only 1 virus is resistant to the neuraminidase inhibitors, others are still sensitive to the neuraminidase inhibitors. The resistant strain, A/Hunan/SWL3/2009(H1N1), was isolated from an imported case of Hunan province and had been reported to WHO in early July, 2009.
[1]
[2]
[3]
